 Web Server Statistics for ericdannewitz.com
Program started on Tue, Jun 09 2026 at 3:27 AM.
Analyzed requests from Mon, Jun 01 2026 at 12:50 AM to Tue, Jun 09 2026 at 12:03 AM (7.97 days).
Web Server Statistics for ericdannewitz.comProgram started on Tue, Jun 09 2026 at 3:27 AM.
Analyzed requests from Mon, Jun 01 2026 at 12:50 AM to Tue, Jun 09 2026 at 12:03 AM (7.97 days).
(Go To: Top | General Summary | Weekly Report | Daily Report | Daily Summary | Hourly Summary | Organization Report | Host Report | Failed Referrer Report | Referrer Report | Referring Site Report | Browser Report | Browser Summary | Operating System Report | Status Code Report | File Type Report | Directory Report | Failure Report | Request Report)
Figures in parentheses refer to the 7-day period ending Jun 09 2026 at 3:27 AM.
Successful requests: 9,240 (7,992)
Average successful requests per day: 1,159 (1,141)
Successful requests for pages: 8,609 (7,491)
Average successful requests for pages per day: 1,080 (1,070)
Failed requests: 14,158 (2,186)
Redirected requests: 3,851 (286)
Distinct files requested: 1,655 (233)
Distinct hosts served: 1,194 (149)
Data transferred: 203.08 megabytes (194.92 megabytes)
Average data transferred per day: 25.49 megabytes (27.85 megabytes)
(Go To: Top | General Summary | Weekly Report | Daily Report | Daily Summary | Hourly Summary | Organization Report | Host Report | Failed Referrer Report | Referrer Report | Referring Site Report | Browser Report | Browser Summary | Operating System Report | Status Code Report | File Type Report | Directory Report | Failure Report | Request Report)
Each unit ( ) represents 200 requests for pages or part thereof.
| week beg. | #reqs | #pages | |
|---|---|---|---|
| May/31/26 | 7031 | 6509 |  |
| Jun/ 7/26 | 2209 | 2100 |   |
Busiest week: week beginning May/31/26 (6,509 requests for pages).
(Go To: Top | General Summary | Weekly Report | Daily Report | Daily Summary | Hourly Summary | Organization Report | Host Report | Failed Referrer Report | Referrer Report | Referring Site Report | Browser Report | Browser Summary | Operating System Report | Status Code Report | File Type Report | Directory Report | Failure Report | Request Report)
Each unit () represents 50 requests for pages or part thereof.
| date | #reqs | #pages | |
|---|---|---|---|
| Jun/ 1/26 | 1187 | 1057 |   |
| Jun/ 2/26 | 1172 | 1091 | |
| Jun/ 3/26 | 1745 | 1672 | |
| Jun/ 4/26 | 830 | 709 | |
| Jun/ 5/26 | 1177 | 1131 | |
| Jun/ 6/26 | 920 | 849 | |
| Jun/ 7/26 | 1196 | 1152 | |
| Jun/ 8/26 | 1006 | 941 | |
| Jun/ 9/26 | 7 | 7 | |
Busiest day: Jun/ 3/26 (1,672 requests for pages).
(Go To: Top | General Summary | Weekly Report | Daily Report | Daily Summary | Hourly Summary | Organization Report | Host Report | Failed Referrer Report | Referrer Report | Referring Site Report | Browser Report | Browser Summary | Operating System Report | Status Code Report | File Type Report | Directory Report | Failure Report | Request Report)
Each unit () represents 50 requests for pages or part thereof.
| day | #reqs | #pages | |
|---|---|---|---|
| Sun | 1196 | 1152 | |
| Mon | 2193 | 1998 | |
| Tue | 1179 | 1098 | |
| Wed | 1745 | 1672 | |
| Thu | 830 | 709 | |
| Fri | 1177 | 1131 | |
| Sat | 920 | 849 | |
(Go To: Top | General Summary | Weekly Report | Daily Report | Daily Summary | Hourly Summary | Organization Report | Host Report | Failed Referrer Report | Referrer Report | Referring Site Report | Browser Report | Browser Summary | Operating System Report | Status Code Report | File Type Report | Directory Report | Failure Report | Request Report)
Each unit () represents 25 requests for pages or part thereof.
| hour | #reqs | #pages | |
|---|---|---|---|
| 0 | 173 | 152 | |
| 1 | 161 | 155 | |
| 2 | 394 | 374 | |
| 3 | 252 | 216 | |
| 4 | 217 | 212 | |
| 5 | 769 | 749 | |
| 6 | 244 | 180 | |
| 7 | 430 | 430 | |
| 8 | 190 | 140 | |
| 9 | 1059 | 1033 | |
| 10 | 329 | 323 | |
| 11 | 348 | 313 | |
| 12 | 384 | 365 | |
| 13 | 677 | 666 | |
| 14 | 225 | 191 | |
| 15 | 414 | 397 | |
| 16 | 463 | 402 | |
| 17 | 205 | 181 | |
| 18 | 622 | 596 | |
| 19 | 493 | 457 | |
| 20 | 249 | 228 | |
| 21 | 343 | 325 | |
| 22 | 429 | 376 | |
| 23 | 170 | 148 | |
(Go To: Top | General Summary | Weekly Report | Daily Report | Daily Summary | Hourly Summary | Organization Report | Host Report | Failed Referrer Report | Referrer Report | Referring Site Report | Browser Report | Browser Summary | Operating System Report | Status Code Report | File Type Report | Directory Report | Failure Report | Request Report)
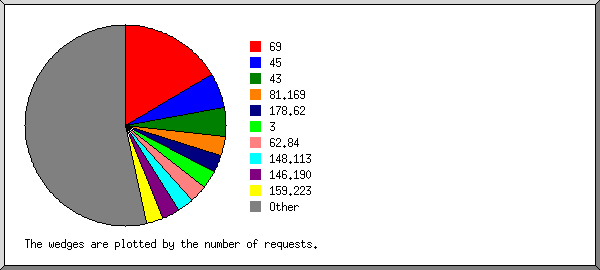
Listing the top 20 organizations by the number of requests, sorted by the number of requests.
| #reqs | %bytes | organization |
|---|---|---|
| 1533 | 2.75% | 69 |
| 516 | 11.08% | 45 |
| 432 | 2.02% | 43 |
| 283 | 1.17% | 81.169 |
| 264 | 1.08% | 178.62 |
| 258 | 1.27% | 3 |
| 258 | 1.06% | 62.84 |
| 253 | 0.97% | 148.113 |
| 250 | 1.02% | 146.190 |
| 248 | 1.02% | 159.223 |
| 247 | 0.98% | 143.198 |
| 239 | 0.92% | 167.172 |
| 236 | 0.99% | 88 |
| 234 | 0.96% | 167.99 |
| 230 | 0.94% | 164.132 |
| 225 | 0.91% | 195.154 |
| 224 | 0.89% | 117 |
| 182 | 0.93% | 82 |
| 175 | 0.71% | 92 |
| 172 | 0.07% | 216.73 |
| 2781 | 68.26% | [not listed: 233 organizations] |
(Go To: Top | General Summary | Weekly Report | Daily Report | Daily Summary | Hourly Summary | Organization Report | Host Report | Failed Referrer Report | Referrer Report | Referring Site Report | Browser Report | Browser Summary | Operating System Report | Status Code Report | File Type Report | Directory Report | Failure Report | Request Report)
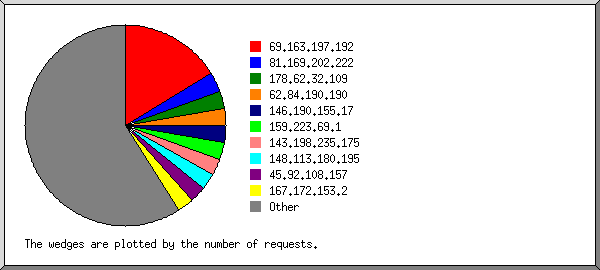
Listing the top 20 hosts by the number of requests, sorted by the number of requests.
| #reqs | %bytes | host |
|---|---|---|
| 1518 | 2.64% | 69.163.197.192 |
| 283 | 1.17% | 81.169.202.222 |
| 264 | 1.08% | 178.62.32.109 |
| 258 | 1.06% | 62.84.190.190 |
| 250 | 1.02% | 146.190.155.17 |
| 248 | 1.02% | 159.223.69.1 |
| 247 | 0.98% | 143.198.235.175 |
| 243 | 0.97% | 148.113.180.195 |
| 240 | 0.98% | 45.92.108.157 |
| 239 | 0.92% | 167.172.153.2 |
| 234 | 0.96% | 88.87.70.158 |
| 234 | 0.96% | 167.99.212.66 |
| 231 | 0.93% | 3.127.95.30 |
| 230 | 0.94% | 164.132.49.123 |
| 225 | 0.91% | 195.154.169.177 |
| 219 | 0.87% | 45.33.94.199 |
| 213 | 0.86% | 43.156.13.166 |
| 212 | 0.86% | 117.50.56.125 |
| 175 | 0.71% | 82.65.178.212 |
| 172 | 0.70% | 92.255.78.30 |
| 3305 | 79.46% | [not listed: 1,174 hosts] |
(Go To: Top | General Summary | Weekly Report | Daily Report | Daily Summary | Hourly Summary | Organization Report | Host Report | Failed Referrer Report | Referrer Report | Referring Site Report | Browser Report | Browser Summary | Operating System Report | Status Code Report | File Type Report | Directory Report | Failure Report | Request Report)
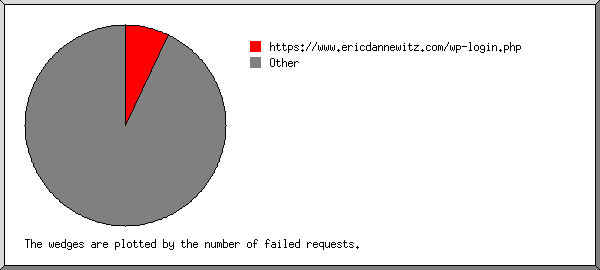
Listing the top 20 referring URLs by the number of failed requests, sorted by the number of failed requests.
(Go To: Top | General Summary | Weekly Report | Daily Report | Daily Summary | Hourly Summary | Organization Report | Host Report | Failed Referrer Report | Referrer Report | Referring Site Report | Browser Report | Browser Summary | Operating System Report | Status Code Report | File Type Report | Directory Report | Failure Report | Request Report)
Listing the top 50 referring URLs by the number of requests, sorted by the number of requests.
(Go To: Top | General Summary | Weekly Report | Daily Report | Daily Summary | Hourly Summary | Organization Report | Host Report | Failed Referrer Report | Referrer Report | Referring Site Report | Browser Report | Browser Summary | Operating System Report | Status Code Report | File Type Report | Directory Report | Failure Report | Request Report)
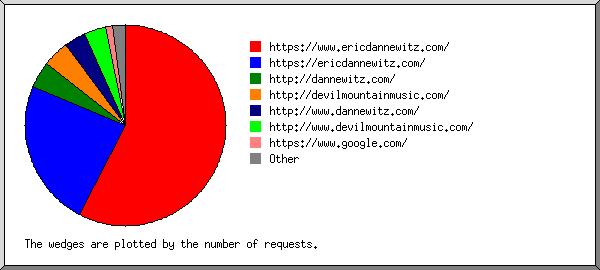
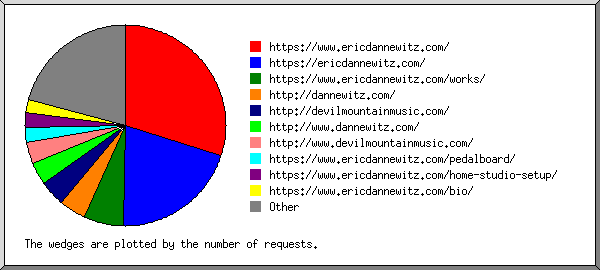
Listing referring sites, sorted by the number of requests.
| #reqs | site |
|---|---|
| 779 | https://www.ericdannewitz.com/ |
| 324 | https://ericdannewitz.com/ |
| 58 | http://dannewitz.com/ |
| 57 | http://devilmountainmusic.com/ |
| 48 | http://www.dannewitz.com/ |
| 47 | http://www.devilmountainmusic.com/ |
| 17 | https://www.google.com/ |
| 10 | https://99.65.78.105/ |
| 9 | https://m.baidu.com/ |
| 2 | http://ye4oosf310yykm9o.dannewitz.com/ |
| 2 | https://duckduckgo.com/ |
| 1 | https://themetix.com/ |
| 1 | https://www.jazz-sax.com/ |
| 1 | http://m.facebook.com/ |
(Go To: Top | General Summary | Weekly Report | Daily Report | Daily Summary | Hourly Summary | Organization Report | Host Report | Failed Referrer Report | Referrer Report | Referring Site Report | Browser Report | Browser Summary | Operating System Report | Status Code Report | File Type Report | Directory Report | Failure Report | Request Report)
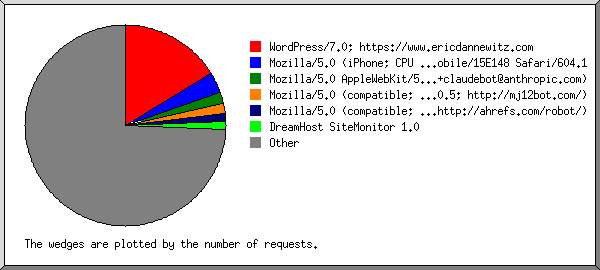
Listing the top 40 browsers by the number of requests for pages, sorted by the number of requests.
| #reqs | #pages | browser |
|---|---|---|
| 1518 | 1518 | WordPress/7.0; https://www.ericdannewitz.com |
| 304 | 304 | Mozilla/5.0 (iPhone; CPU iPhone OS 13_2_3 like Mac OS X) AppleWebKit/605.1.15 (KHTML, like Gecko) Version/13.0.3 Mobile/15E148 Safari/604.1 |
| 167 | 167 | Mozilla/5.0 AppleWebKit/537.36 (KHTML, like Gecko; compatible; ClaudeBot/1.0; +claudebot@anthropic.com) |
| 153 | 153 | Mozilla/5.0 (compatible; MJ12bot/v2.0.5; http://mj12bot.com/) |
| 117 | 100 | Mozilla/5.0 (compatible; AhrefsBot/7.0; +http://ahrefs.com/robot/) |
| 111 | 111 | DreamHost SiteMonitor 1.0 |
| 92 | 92 | Mozilla/5.0 (Windows NT 10.0; Win64; x64; rv:82.0) Gecko/20100101 Firefox/82.0 |
| 90 | 90 | Mozilla/5.0 (Windows NT 10.0; Win64; x64; rv:70.0) Gecko/20100101 Firefox/70.0 |
| 88 | 88 | Mozilla/5.0 (Windows NT 10.0; Win64; x64; rv:42.0) Gecko/20100101 Firefox/42.0 |
| 87 | 87 | Mozilla/5.0 (Windows NT 10.0; Win64; x64; rv:65.0) Gecko/20100101 Firefox/65.0 |
| 86 | 86 | Mozilla/5.0 (Windows NT 10.0; Win64; x64; rv:77.0) Gecko/20100101 Firefox/77.0 |
| 85 | 85 | Mozilla/5.0 (Windows NT 10.0; Win64; x64; rv:75.0) Gecko/20100101 Firefox/75.0 |
| 85 | 85 | Mozilla/5.0 (Windows NT 10.0; Win64; x64; rv:81.0) Gecko/20100101 Firefox/81.0 |
| 84 | 84 | Mozilla/5.0 (Windows NT 10.0; Win64; x64; rv:97.0) Gecko/20100101 Firefox/97.0 |
| 83 | 83 | Mozilla/5.0 (Windows NT 10.0; Win64; x64; rv:79.0) Gecko/20100101 Firefox/79.0 |
| 83 | 83 | Mozilla/5.0 (Windows NT 10.0; Win64; x64; rv:58.0) Gecko/20100101 Firefox/58.0 |
| 82 | 82 | Mozilla/5.0 (Windows NT 10.0; Win64; x64; rv:60.0) Gecko/20100101 Firefox/60.0 |
| 82 | 82 | Mozilla/5.0 (Windows NT 10.0; Win64; x64; rv:98.0) Gecko/20100101 Firefox/98.0 |
| 80 | 80 | Mozilla/5.0 (Windows NT 10.0; Win64; x64; rv:46.0) Gecko/20100101 Firefox/46.0 |
| 79 | 79 | Mozilla/5.0 (Windows NT 10.0; Win64; x64; rv:95.0) Gecko/20100101 Firefox/95.0 |
| 79 | 79 | Mozilla/5.0 (Windows NT 10.0; Win64; x64; rv:41.0) Gecko/20100101 Firefox/41.0 |
| 79 | 79 | Mozilla/5.0 (Windows NT 10.0; Win64; x64; rv:92.0) Gecko/20100101 Firefox/92.0 |
| 79 | 79 | Mozilla/5.0 (Windows NT 10.0; Win64; x64; rv:68.0) Gecko/20100101 Firefox/68.0 |
| 78 | 78 | Mozilla/5.0 (Windows NT 10.0; Win64; x64; rv:54.0) Gecko/20100101 Firefox/54.0 |
| 78 | 78 | Mozilla/5.0 (Windows NT 10.0; Win64; x64; rv:59.0) Gecko/20100101 Firefox/59.0 |
| 78 | 78 | Mozilla/5.0 (Windows NT 10.0; Win64; x64; rv:48.0) Gecko/20100101 Firefox/48.0 |
| 77 | 77 | Mozilla/5.0 (Windows NT 10.0; Win64; x64; rv:57.0) Gecko/20100101 Firefox/57.0 |
| 77 | 77 | Mozilla/5.0 (Windows NT 10.0; Win64; x64; rv:43.0) Gecko/20100101 Firefox/43.0 |
| 76 | 76 | Mozilla/5.0 (Windows NT 10.0; Win64; x64; rv:71.0) Gecko/20100101 Firefox/71.0 |
| 76 | 76 | Mozilla/5.0 (Windows NT 10.0; Win64; x64; rv:93.0) Gecko/20100101 Firefox/93.0 |
| 75 | 75 | Mozilla/5.0 (Windows NT 10.0; Win64; x64; rv:64.0) Gecko/20100101 Firefox/64.0 |
| 75 | 75 | Mozilla/5.0 (Windows NT 10.0; Win64; x64; rv:50.0) Gecko/20100101 Firefox/50.0 |
| 75 | 75 | Mozilla/5.0 (Windows NT 10.0; Win64; x64; rv:55.0) Gecko/20100101 Firefox/55.0 |
| 75 | 75 | Mozilla/5.0 (Windows NT 10.0; Win64; x64; rv:61.0) Gecko/20100101 Firefox/61.0 |
| 74 | 74 | Mozilla/5.0 (Windows NT 10.0; Win64; x64; rv:44.0) Gecko/20100101 Firefox/44.0 |
| 74 | 74 | Mozilla/5.0 (Windows NT 10.0; Win64; x64; rv:66.0) Gecko/20100101 Firefox/66.0 |
| 74 | 74 | Mozilla/5.0 (Windows NT 10.0; Win64; x64; rv:67.0) Gecko/20100101 Firefox/67.0 |
| 73 | 73 | Mozilla/5.0 (Windows NT 10.0; Win64; x64; rv:94.0) Gecko/20100101 Firefox/94.0 |
| 73 | 73 | Mozilla/5.0 (Windows NT 10.0; Win64; x64; rv:69.0) Gecko/20100101 Firefox/69.0 |
| 73 | 73 | Jetpack by WordPress.com |
| 4165 | 3551 | [not listed: 443 browsers] |
(Go To: Top | General Summary | Weekly Report | Daily Report | Daily Summary | Hourly Summary | Organization Report | Host Report | Failed Referrer Report | Referrer Report | Referring Site Report | Browser Report | Browser Summary | Operating System Report | Status Code Report | File Type Report | Directory Report | Failure Report | Request Report)
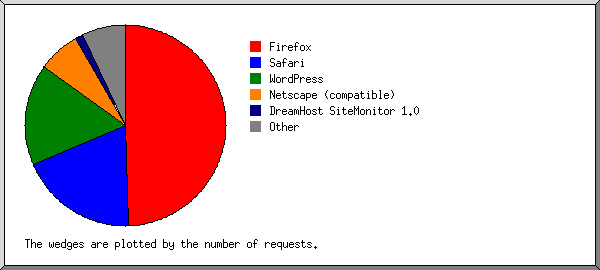
Listing the top 20 browsers by the number of requests for pages, sorted by the number of requests.
| # | #reqs | #pages | browser |
|---|---|---|---|
| 1 | 4571 | 4571 | Firefox |
| 92 | 92 | Firefox/82 | |
| 90 | 90 | Firefox/70 | |
| 88 | 88 | Firefox/42 | |
| 87 | 87 | Firefox/65 | |
| 86 | 86 | Firefox/77 | |
| 85 | 85 | Firefox/75 | |
| 85 | 85 | Firefox/81 | |
| 84 | 84 | Firefox/97 | |
| 83 | 83 | Firefox/58 | |
| 83 | 83 | Firefox/79 | |
| 2 | 1761 | 1241 | Safari |
| 1202 | 799 | Safari/537 | |
| 435 | 352 | Safari/604 | |
| 94 | 61 | Safari/605 | |
| 21 | 20 | Safari/600 | |
| 4 | 4 | Safari/534 | |
| 1 | 1 | Safari/12 | |
| 1 | 1 | Safari/13 | |
| 1 | 1 | Safari/601 | |
| 1 | 1 | Safari/412 | |
| 1 | 1 | Safari/417 | |
| 3 | 1518 | 1518 | WordPress |
| 1518 | 1518 | WordPress/7 | |
| 4 | 629 | 584 | Netscape (compatible) |
| 5 | 111 | 111 | DreamHost SiteMonitor 1.0 |
| 6 | 91 | 37 | Mozilla |
| 7 | 78 | 78 | Jetpack |
| 63 | 63 | Jetpack/12 | |
| 15 | 15 | Jetpack/13 | |
| 8 | 77 | 76 | Go-http-client |
| 64 | 63 | Go-http-client/2 | |
| 13 | 13 | Go-http-client/1 | |
| 9 | 73 | 73 | Jetpack by WordPress.com |
| 10 | 70 | 70 | WordPress.com; https: |
| 70 | 70 | WordPress.com; https://wordpress | |
| 11 | 39 | 39 | meta-externalagent |
| 39 | 39 | meta-externalagent/1 | |
| 12 | 27 | 20 | facebookexternalhit |
| 27 | 20 | facebookexternalhit/1 | |
| 13 | 26 | 26 | Sogou web spider |
| 26 | 26 | Sogou web spider/4 | |
| 14 | 15 | 15 | Sidetrade indexer bot |
| 15 | 10 | 10 | Jetpack by WordPress.com (Jetpack 12.0; WordPress 6.3) |
| 16 | 8 | 8 | Jetpack by WordPress.com (Jetpack 13.0; WordPress 6.4) |
| 17 | 8 | 8 | curl |
| 6 | 6 | curl/8 | |
| 1 | 1 | curl/7 | |
| 18 | 8 | 8 | DreamHost Data Team (+http: |
| 8 | 8 | DreamHost Data Team (+http://www | |
| 19 | 7 | 7 | Jetpack by WordPress.com (Jetpack 13.0; WordPress 6.3) |
| 20 | 7 | 7 | Hello from Palo Alto Networks, find out more about our scans in https: |
| 7 | 7 | Hello from Palo Alto Networks, find out more about our scans in https://docs-cortex | |
| 105 | 101 | [not listed: 34 browsers] |
(Go To: Top | General Summary | Weekly Report | Daily Report | Daily Summary | Hourly Summary | Organization Report | Host Report | Failed Referrer Report | Referrer Report | Referring Site Report | Browser Report | Browser Summary | Operating System Report | Status Code Report | File Type Report | Directory Report | Failure Report | Request Report)
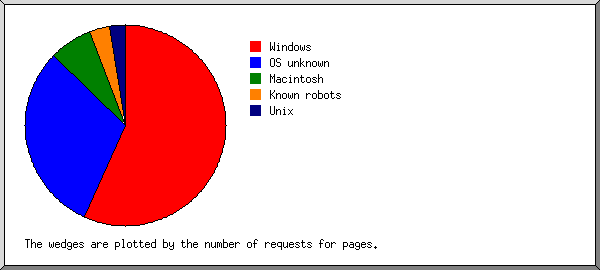
Listing operating systems, sorted by the number of requests for pages.
| # | #reqs | #pages | OS |
|---|---|---|---|
| 1 | 4936 | 4881 | Windows |
| 4893 | 4838 | Windows NT | |
| 23 | 23 | Windows 7 | |
| 19 | 19 | Unknown Windows | |
| 1 | 1 | Windows XP | |
| 2 | 2718 | 2636 | OS unknown |
| 3 | 834 | 598 | Macintosh |
| 4 | 412 | 282 | Known robots |
| 5 | 339 | 211 | Unix |
| 336 | 208 | Linux | |
| 2 | 2 | Other Unix | |
| 1 | 1 | BSD |
(Go To: Top | General Summary | Weekly Report | Daily Report | Daily Summary | Hourly Summary | Organization Report | Host Report | Failed Referrer Report | Referrer Report | Referring Site Report | Browser Report | Browser Summary | Operating System Report | Status Code Report | File Type Report | Directory Report | Failure Report | Request Report)
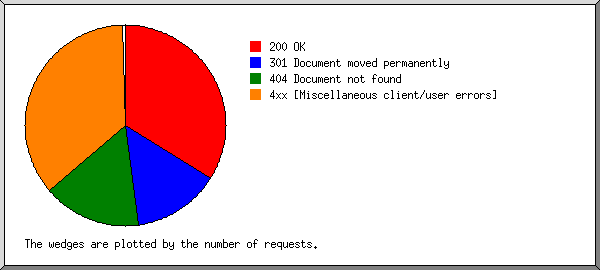
Listing status codes, sorted numerically.
| #reqs | status code |
|---|---|
| 9222 | 200 OK |
| 16 | 206 Partial content |
| 3819 | 301 Document moved permanently |
| 32 | 302 Document found elsewhere |
| 2 | 304 Not modified since last retrieval |
| 38 | 401 Authentication required |
| 4300 | 404 Document not found |
| 7 | 405 Method not allowed |
| 6 | 408 Request timeout |
| 1 | 409 Request conflicts with state of resource |
| 9787 | 4xx [Miscellaneous client/user errors] |
| 19 | 500 Internal server error |
(Go To: Top | General Summary | Weekly Report | Daily Report | Daily Summary | Hourly Summary | Organization Report | Host Report | Failed Referrer Report | Referrer Report | Referring Site Report | Browser Report | Browser Summary | Operating System Report | Status Code Report | File Type Report | Directory Report | Failure Report | Request Report)
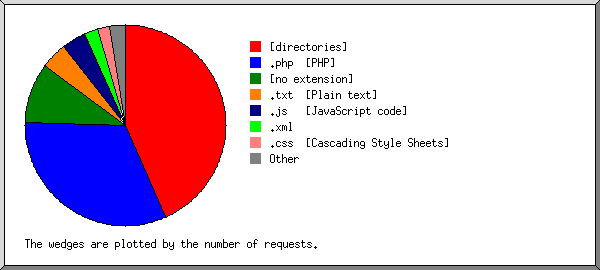
Listing extensions, sorted by the number of requests.
| #reqs | %bytes | extension |
|---|---|---|
| 3999 | 20.57% | [directories] |
| 2961 | 6.66% | .php [PHP] |
| 906 | 4.21% | [no extension] |
| 400 | 0.46% | .txt [Plain text] |
| 361 | 1.17% | .js [JavaScript code] |
| 203 | 0.05% | .xml |
| 185 | 0.94% | .css [Cascading Style Sheets] |
| 56 | 2.29% | .woff2 |
| 43 | 4.33% | .jpg [JPEG graphics] |
| 42 | 0.09% | .png [PNG graphics] |
| 40 | 0.04% | .ico |
| 38 | 59.20% | .m4a |
| 5 | .svg | |
| 1 | .html [Hypertext Markup Language] |
(Go To: Top | General Summary | Weekly Report | Daily Report | Daily Summary | Hourly Summary | Organization Report | Host Report | Failed Referrer Report | Referrer Report | Referring Site Report | Browser Report | Browser Summary | Operating System Report | Status Code Report | File Type Report | Directory Report | Failure Report | Request Report)
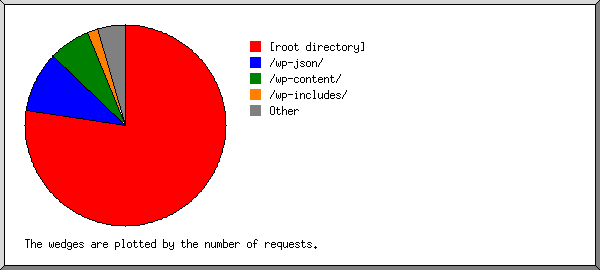
Listing directories, sorted by the number of requests.
| #reqs | %bytes | directory |
|---|---|---|
| 7151 | 27.22% | [root directory] |
| 900 | 2.33% | /wp-json/ |
| 620 | 67.05% | /wp-content/ |
| 162 | 1.16% | /wp-includes/ |
| 73 | 0.06% | /wp-admin/ |
| 44 | 0.27% | /works/ |
| 43 | 0.30% | /instrument-setups/ |
| 37 | 0.26% | /home-studio-setup/ |
| 35 | 0.23% | /studio-setup/ |
| 33 | 0.23% | /bio/ |
| 31 | 0.23% | /calendar/ |
| 30 | 0.26% | /recordings/ |
| 30 | 0.19% | /resume/ |
| 28 | 0.19% | /pedalboard/ |
| 10 | 0.01% | /feed/ |
| 7 | 0.01% | /about/ |
| 5 | 0.01% | /comments/ |
| 1 | 0.01% | /tag/ |
(Go To: Top | General Summary | Weekly Report | Daily Report | Daily Summary | Hourly Summary | Organization Report | Host Report | Failed Referrer Report | Referrer Report | Referring Site Report | Browser Report | Browser Summary | Operating System Report | Status Code Report | File Type Report | Directory Report | Failure Report | Request Report)
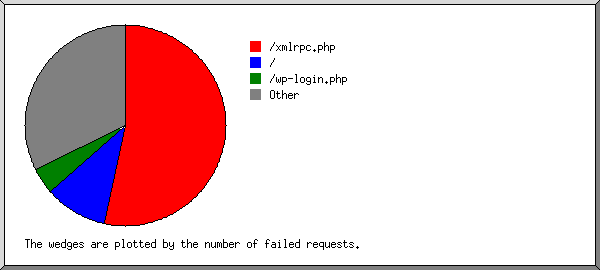
Listing the top 10 files by the number of failed requests, sorted by the number of failed requests.
| #reqs | file |
|---|---|
| 7555 | /xmlrpc.php |
| 12 | /xmlrpc.php?rsd |
| 1425 | / |
| 871 | /?author=1 |
| 595 | /wp-login.php |
| 29 | /wp-admin/ |
| 18 | /wp-content/themes/seotheme/db.php |
| 18 | /wp-content/themes/seotheme/db.php?u |
| 17 | /.env |
| 13 | /wp-json/wp/v2/users/me |
| 13 | /images/images/cache.php |
| 12 | /wp1/wp-includes/wlwmanifest.xml |
| 12 | /blog/wp-includes/wlwmanifest.xml |
| 4469 | [not listed: 2,155 files] |
(Go To: Top | General Summary | Weekly Report | Daily Report | Daily Summary | Hourly Summary | Organization Report | Host Report | Failed Referrer Report | Referrer Report | Referring Site Report | Browser Report | Browser Summary | Operating System Report | Status Code Report | File Type Report | Directory Report | Failure Report | Request Report)
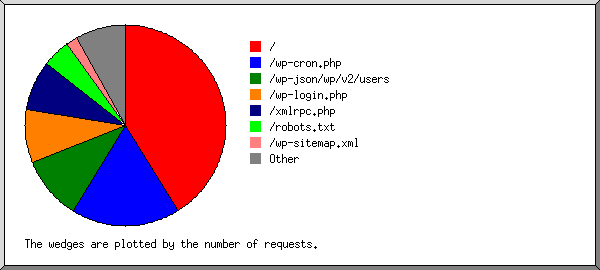
Listing the top 30 files by the number of requests, sorted by the number of requests.
| #reqs | %bytes | last time | file |
|---|---|---|---|
| 3541 | 19.17% | Jun/ 9/26 12:03 AM | / |
| 864 | 4.65% | Jun/ 8/26 1:23 PM | /?author=2 |
| 858 | 4.61% | Jun/ 8/26 1:23 PM | /?author=3 |
| 1510 | 2.76% | Jun/ 9/26 12:03 AM | /wp-cron.php |
| 872 | 2.03% | Jun/ 8/26 1:23 PM | /wp-json/wp/v2/users |
| 745 | 2.91% | Jun/ 8/26 2:21 PM | /wp-login.php |
| 699 | 1.33% | Jun/ 8/26 3:04 PM | /xmlrpc.php |
| 394 | 0.43% | Jun/ 8/26 11:54 PM | /robots.txt |
| 153 | 0.04% | Jun/ 8/26 10:23 PM | /wp-sitemap.xml |
| 50 | 0.02% | Jun/ 8/26 10:24 PM | /wp-sitemap-posts-page-1.xml |
| 44 | 0.29% | Jun/ 9/26 12:02 AM | /works/ |
| 42 | 0.31% | Jun/ 8/26 5:38 PM | /instrument-setups/ |
| 40 | 0.04% | Jun/ 8/26 2:59 PM | /favicon.ico |
| 36 | 0.28% | Jun/ 8/26 7:55 PM | /home-studio-setup/ |
| 35 | 0.24% | Jun/ 8/26 11:44 PM | /studio-setup/ |
| 33 | 0.25% | Jun/ 8/26 10:32 PM | /bio/ |
| 31 | 0.24% | Jun/ 8/26 11:46 PM | /calendar/ |
| 30 | 0.20% | Jun/ 8/26 3:04 PM | /resume/ |
| 30 | 0.28% | Jun/ 8/26 11:09 PM | /recordings/ |
| 28 | 0.20% | Jun/ 8/26 3:04 PM | /pedalboard/ |
| 26 | 0.33% | Jun/ 8/26 2:59 PM | /wp-content/fonts/courgette/wEO_EBrAnc9BLjLQAUk1VvoK.woff2 |
| 26 | 2.07% | Jun/ 8/26 2:59 PM | /wp-content/themes/rock-star/css/font-awesome/webfonts/fa-solid-900.woff2 |
| 12 | 2.41% | Jun/ 7/26 2:32 AM | /wp-json |
| 12 | 0.02% | Jun/ 7/26 2:32 AM | /wp-json/oembed/1.0/embed |
| 10 | 0.01% | Jun/ 8/26 3:04 PM | /feed/ |
| 9 | 10.09% | Jun/ 8/26 5:49 PM | /wp-content/uploads/2010/05/BillBailey.m4a |
| 8 | 21.15% | Jun/ 8/26 3:22 AM | /wp-content/uploads/2014/11/ComeOnEileen.m4a |
| 8 | 11.68% | Jun/ 7/26 5:48 PM | /wp-content/uploads/2010/05/SingSingSing.m4a |
| 8 | 0.01% | Jun/ 7/26 7:38 PM | /wp-content/uploads/ |
| 8 | 0.01% | Jun/ 7/26 7:40 PM | /wp-admin/maint/ |
| 7 | 0.01% | Jun/ 7/26 7:38 PM | /wp-admin/js/ |
| 7 | Jun/ 7/26 7:39 PM | /wp-admin/js/widgets/ | |
| 155 | 21.18% | Jun/ 8/26 3:04 PM | [not listed: 56 files] |